
Here's a new task I finally had a chance to edit and put together today... Hoping to try it this week!
Draining The Pool
How long will it take to drain the pool?
This Real World 3 Act Math Task will have students making predictions viainterpolation and extrapolation using scatter plots and a line of best fit.
Related Math Topics:
Data management of two-variables including:
- making predictions between two-variables,
- creating scatter plots,
- classifying correlations as positive/negative and strong/weak, and
- interpolating and extrapolating using a line of best fit.
This task can be extended to linear relations and equations by having students determine an equation of the line of best fit or alternatively, non-linear regression to find an equation of a curve of best fit.
If you haven’t already, I recommend using the Candle Burning 3 Act Math Task prior to using this task, as the data appears to have a stronger linear correlation.
Act 1: Introducing the Problem
Show students Act 1:
After showing the video clip, I have students discuss with their group some questions that come to mind. Sometimes, I have students focus on two types of questions:
- The first question that comes to mind; and,
- a unique question you don’t think someone will come up with.
This tends to differentiate the question responses rather than seeing a ton of the most obvious one. We discuss these options, then settle on our first question:
How long will it take to empty the pool?
Then, we move on to Act 2.
Act 2: Reveal Some Useful Information
I personally don’t ask too many questions about what information they want, as most tend to know where this problem is heading.
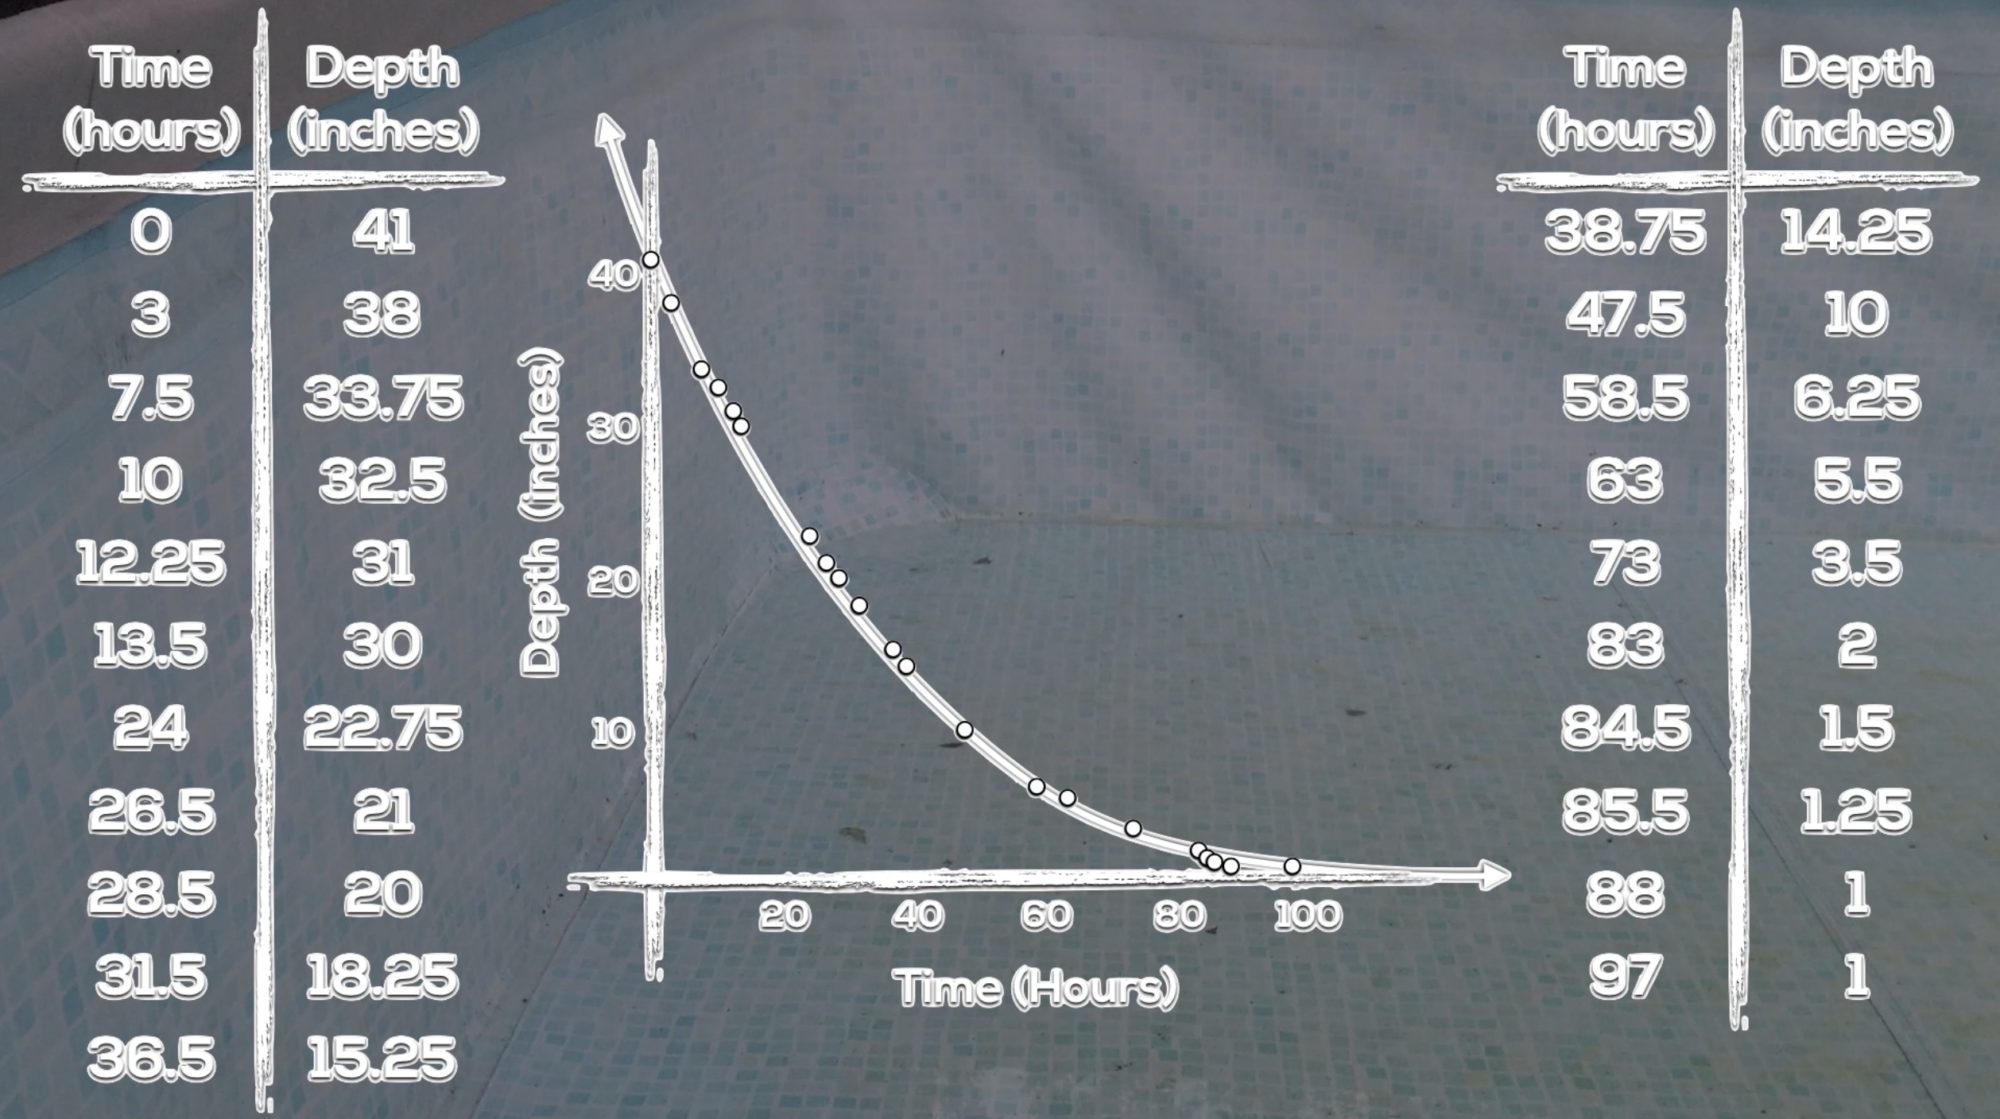
Show them Act 2:
Although I try to avoid fading out my videos to ensure the information doesn’t go away, here’s a screenshot of the last frame, for your use:

Feel free to save the image.
At this point, students can head off on their merry way. I find most of my students tend to go straight for a scatter plot and extend a line of best fit, while others might choose to try to leverage the initial value/y-intercept and estimate a rate of change/slope to create an equation. At midterm and beyond, I’m hoping that the second option becomes more attractive to my students since we have been working with linear equations quite a bit. If no students head in that direction, I would introduce it during the consolidation of the problem as a potential strategy for future use.
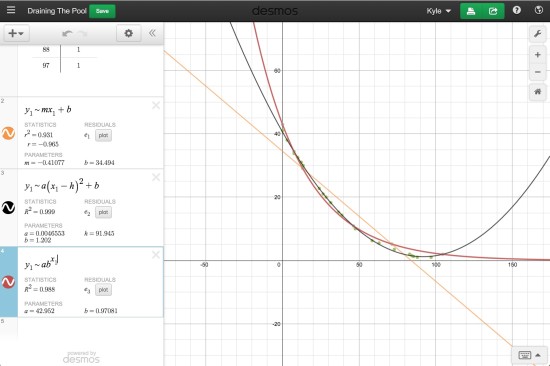
If you’re beyond students drawing scatter plots and want to do something more advanced with this problem, consider using Desmos as a way to manipulate and interpret data.
Click the image below to grab a shared Desmos graph with all the data points plotted from a table of values with regression line/curves:
Act 3: See The Answer!
Once students have updated their prediction based on their mathematical thinking, we can show students Act 3 so they can cheer (or cry) based on what really happened:
Here’s a screenshot of the last frame, if you’d like to use it for some of your consolidation:
Feel free to download the Act 3 image.
Sequels / Extensions
- What do you predict the depth of the pool would be after 17 hours of draining? (interpolation)
- What would be a reasonable drain rate for this pool assuming the trend is linear?
- What would be a reasonable equation for a line (or curve) of best fit?
Please comment to let me know how it worked in your classroom!
Comments